Wednesday, November 20, 2013

Mental Map


A mental map looks a person’s perception of an area of interaction. Mental maps can show things such as how a person perceives geography through things such as geography as well as what their personal preferences are.  


Multispectral Image


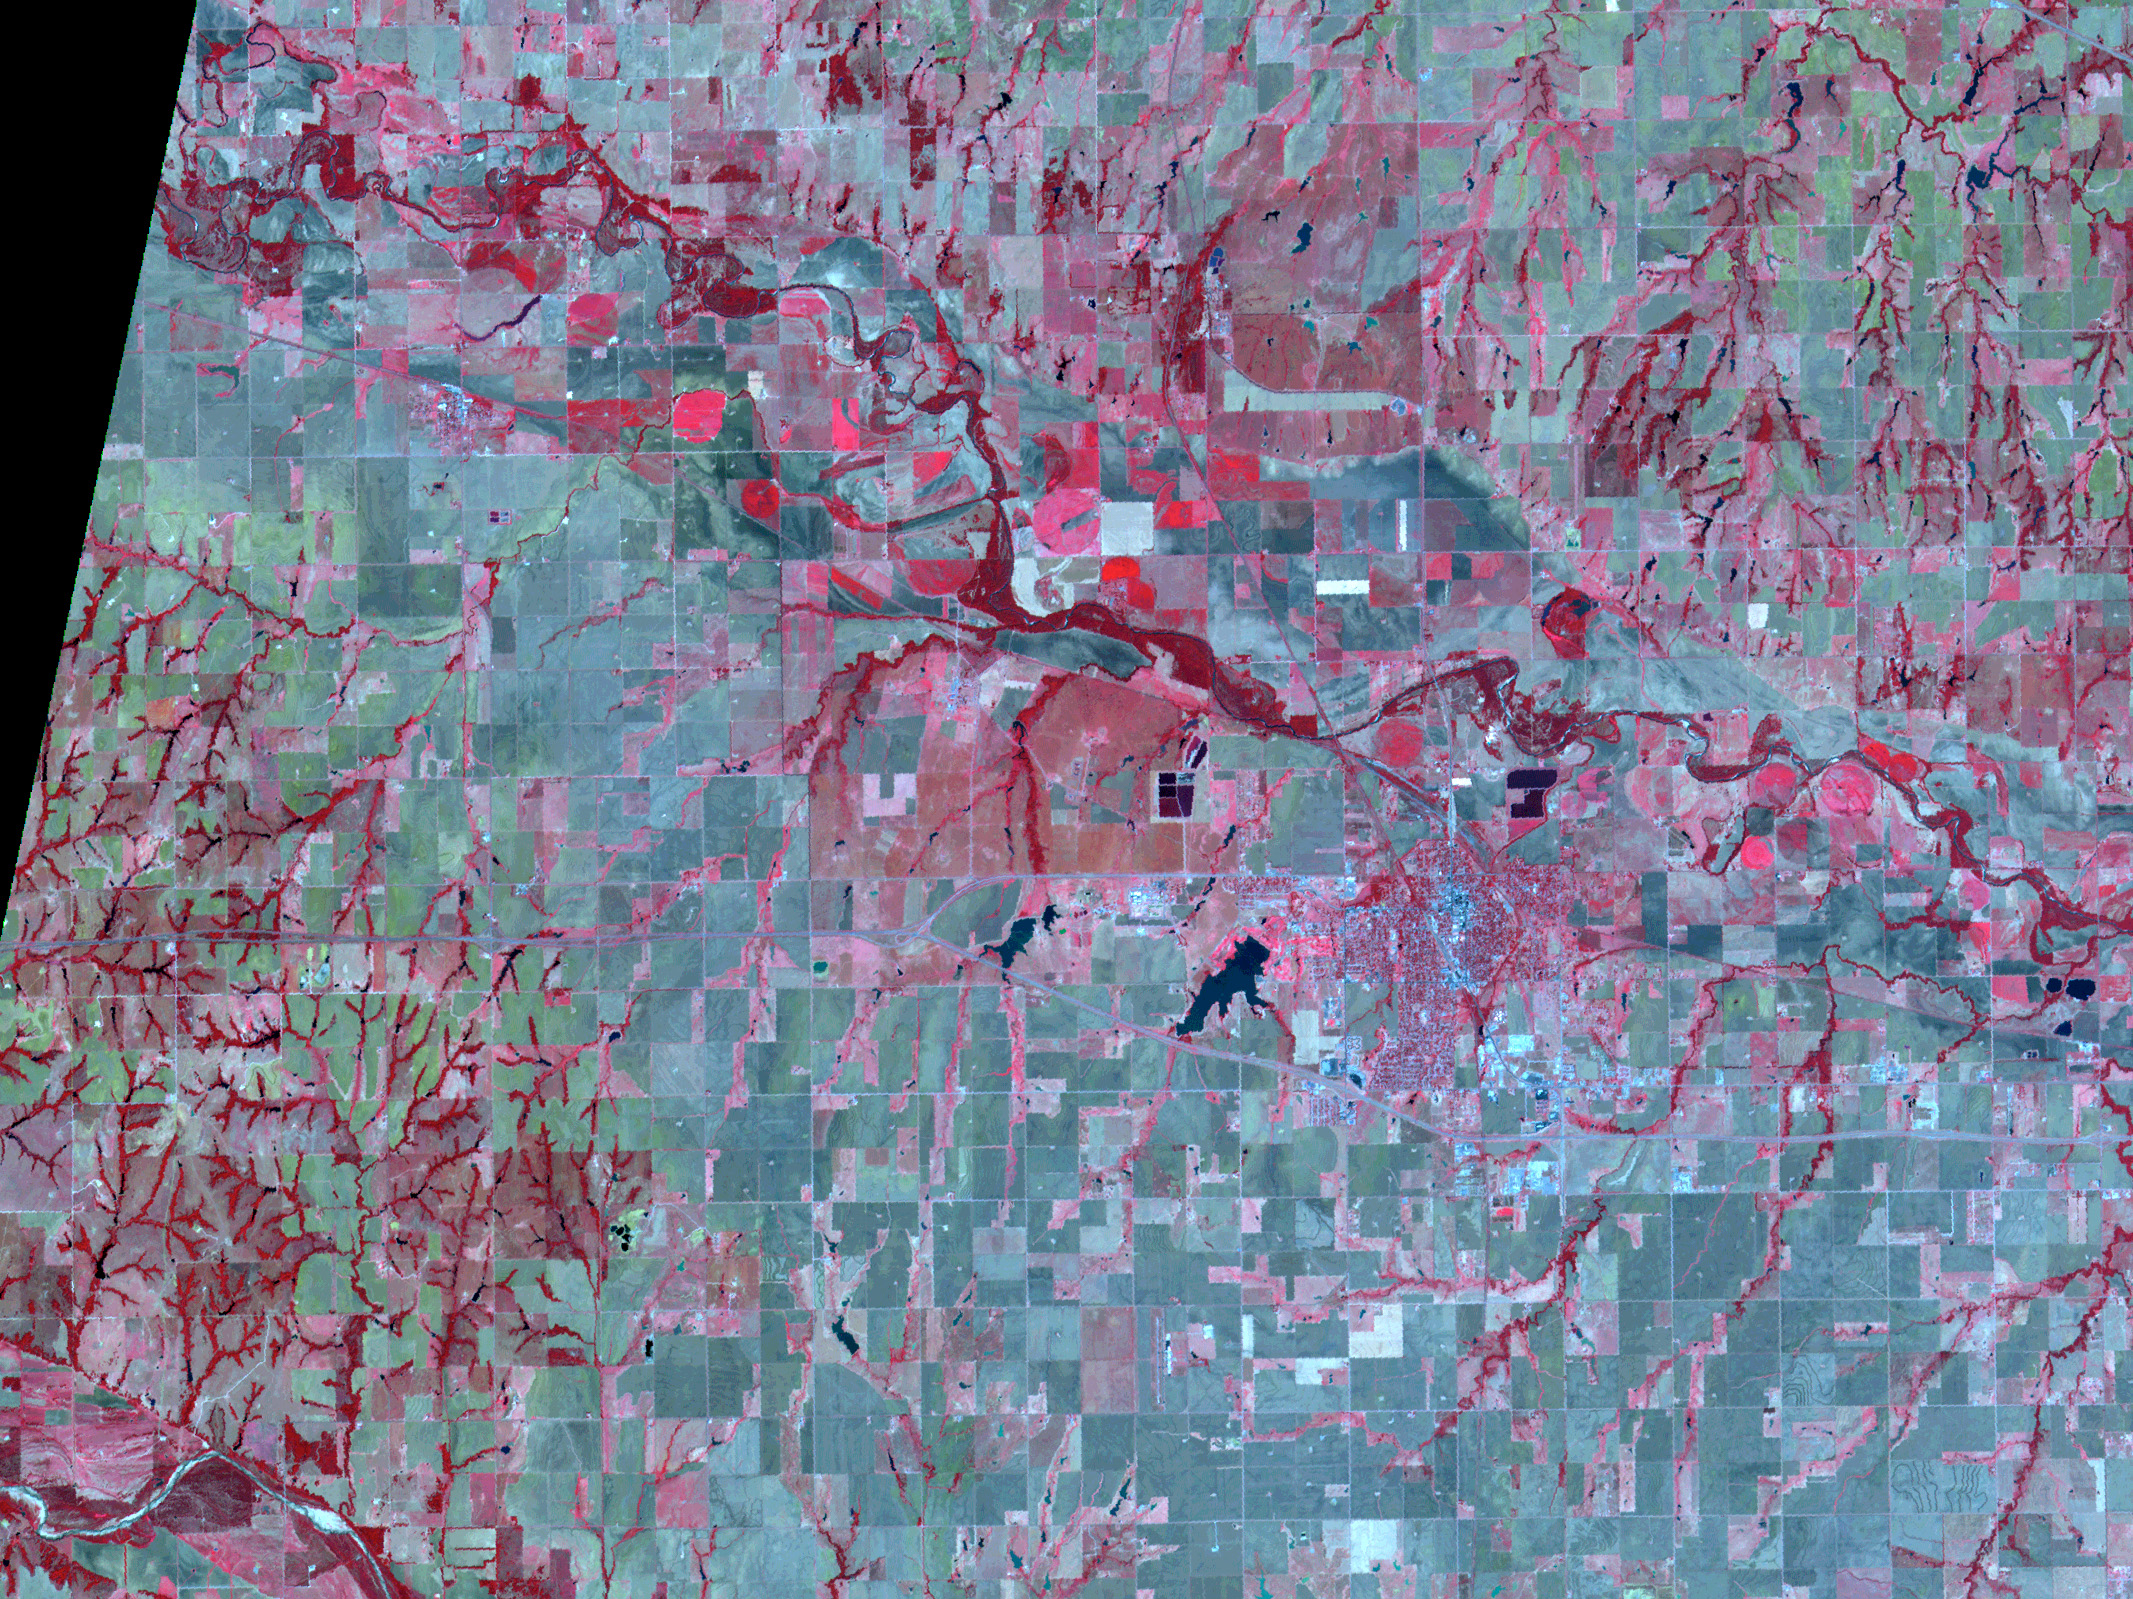
A multispectral sensor detects an extensive range of a spectrum. It divides portions of the spectrum into distinct bands. These individual bands can create single images. These images can then be combined to showcase certain details on the surface. The picture above is an image of El Reno, Oklahoma from a multispectral perspective. 


Sonar


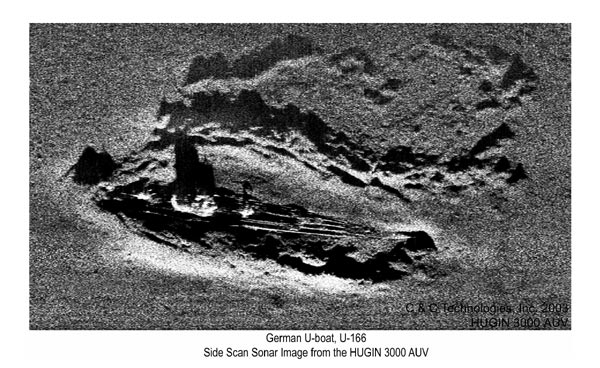
 Sonar sensors involve sound navigation and ranging.  They record the amount of energy back scattered from objects in the water or at the bottom of the ocean. It is based from the transmission of sound waves through the water. Above is a sonar image of a german U-boat from World War II. 


Tuesday, November 19, 2013

Index Value Plot


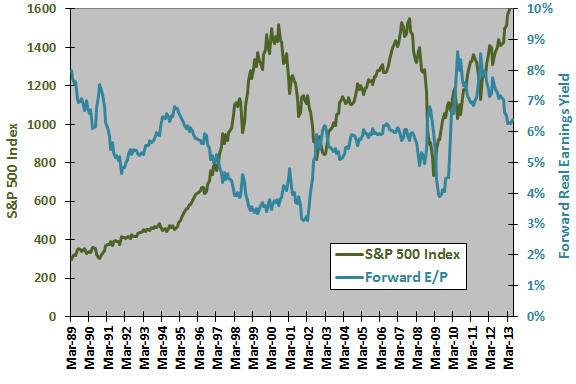
An index value plot depicts an index value on a line graph.  Index value plots are used for things such as stocks, inflation, and other financial aspects. This graph in particular shows comparisons between S&P 500 Index and S&P 500 forward earnings and how they yield over the sample period. This is then related to the forward earnings and how they yield to stock market returns over fixed future intervals. 


Topographic Map


The topographic map is portrayed through large detailed and numerical illustration of relief. Topographic maps typically use contour lines but may also strive to show natural features. Also, the contour lines depicted in these maps are of equal elevation.  


Thematic Map


A thematic map is a map designed to show a specific theme that is connected to an area or region. A thematic map can show a variety of factors. Some of these include politics, economics, cultural aspects, and etc. in any given area throughout the world. For example, this map shows the party control of the Governor’s offices as of January 2007 across the United States. The republicans are depicted in red, and the democrats are shown in blue. Using the thematic map effectively shows the two major parties and their dominance in the United States.