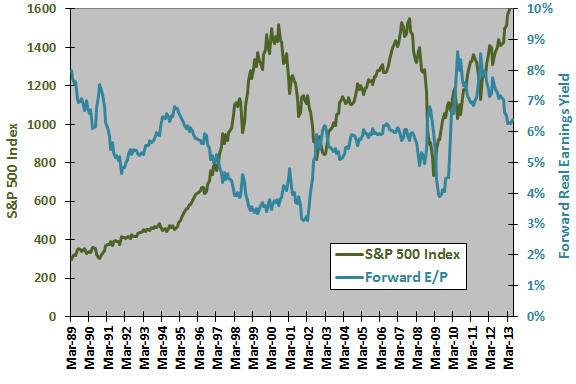
An index value plot depicts an index value on a line
graph. Index value plots are used for
things such as stocks, inflation, and other financial aspects. This graph in
particular shows comparisons between S&P 500 Index and S&P 500 forward
earnings and how they yield over the sample period. This is then related to the
forward earnings and how they yield to stock market returns over fixed future
intervals.
No comments:
Post a Comment