Bivariate choropleth maps use colors to show representation.
This type of map shows 2 variables and strives to show relationship between the
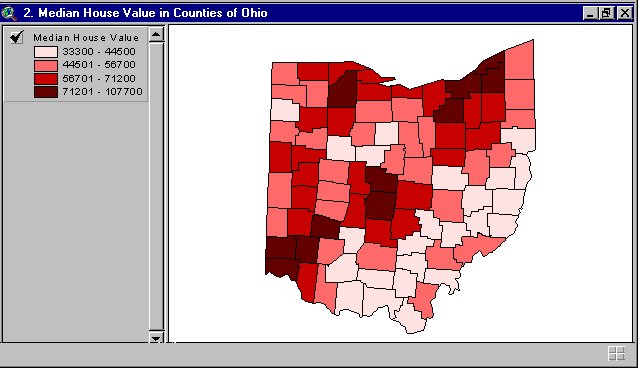
two. Symbols can also be used as well. In this map, house values in counties of
Ohio are differentiated through various shades of red. In the counties with
darker reds, the median house value is higher than the lighter red countries.
No comments:
Post a Comment